
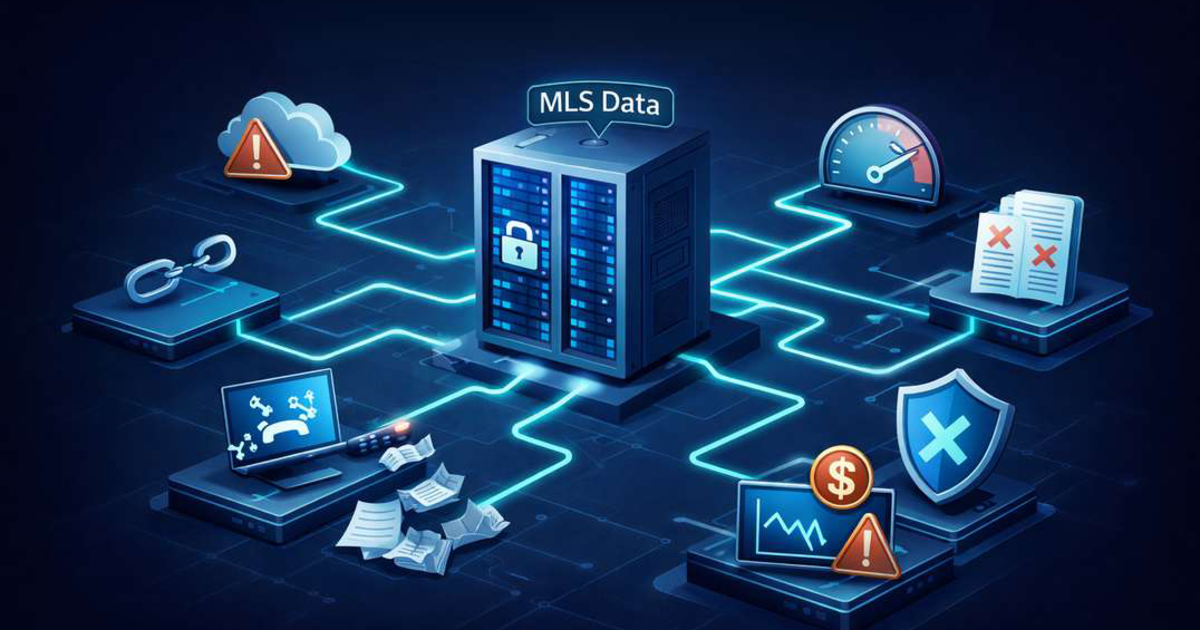
Quick Answer: Seven checks on a sample MLS data extract will surface almost every problem that otherwise appears in production: field completeness on the fields you actually use, status accuracy against the MLS itself, delivered latency rather than quoted latency, normalization consistency across markets, historical archive depth, listing media integrity, and change detection reliability. Each takes minutes to hours on a sample of a few hundred records per market. Running them before signing is the difference between discovering a gap during evaluation and discovering it after the integration is live.
Most MLS data evaluations follow the same pattern. A vendor demonstrates their API, coverage numbers are discussed, pricing is agreed, and the contract is signed. The sample data, if one was provided, was opened once and looked fine.
Once the integration goes live, the problems appear. A filter returns almost nothing in one market because the field is rarely populated there. Listings show as active for hours after going under contract. A feature that works in Phoenix breaks in Cleveland because the status values differ.
None of those are surprises. All of them are visible in a sample extract, and the checks that surface them take a few hours in total. This article covers seven of them as of 2026, what each one catches, and the thresholds worth holding to.
This article is the companion to our guide on how to evaluate a real estate data provider, which covers the questions to put to a vendor. This article covers what to do with the data once they send it.
Before You Start: Ask for the Right Sample
A sample extract is only diagnostic if it resembles what you will actually receive. Three things make the difference.
Request your specific target markets, not a demonstration market. Vendors naturally sample from their strongest integration, and coverage quality varies considerably between markets. A sample from a flagship market tells you what the vendor can do, not what you will get.
Request a realistic sample volume. Two hundred to five hundred active records per market is enough to compute completeness rates that mean something, and small enough to work through in an afternoon. A twenty-record sample is a brochure.
Request sold and expired records alongside active ones. Several of the checks below only work on closed transactions, and archive depth is invisible if the sample contains only current listings.
A vendor that will not provide a sample from your actual markets before signing has answered a different question than the one you asked. That response is itself a data point.
The 7 Checks
1. Field Completeness on the Fields You Actually Use
What the Field Completeness Check Catches
Field completeness is the percentage of records where a given field holds a real value rather than a null or an empty string. It is the single highest-yield check because it catches the failure mode that is invisible until a user complains.
The pattern is consistent. A field appears in the vendor documentation, so the team builds a filter on it. In production the filter returns a fraction of the inventory, because agents in that market rarely populate that field and the filter silently excludes every record where it is blank.
How to Run the Field Completeness Check
Before opening the sample, list the fields your product depends on. For a search product that typically means BedsTotal, BathroomsTotalInteger, LivingArea, LotSizeSquareFeet, YearBuilt and whatever drives your filters. For a CMA tool add ClosePrice, CloseDate, DaysOnMarket and OriginalListPrice. For a portal add SubdivisionName, GarageSpaces and any school or HOA field you plan to expose.
Once the field list is set, compute per market what percentage of records carry a non-null value for each. A spreadsheet handles this in fifteen minutes.
The Field Completeness Threshold
Below 80 percent completeness in a target market, a field will produce visible gaps in production. Below 50 percent it is not usable as a filter at all, and exposing it will make the product look broken rather than the data look incomplete.
Optional fields are where this bites, and the variation is structural rather than random. The US housing stock differs enormously by region in age, type and construction, as the Harvard Joint Center for Housing Studies documents annually, and local data entry conventions reflect those differences. Listing price and address are required at entry and will be near complete everywhere. HOA fees, school assignment, flood designation and lot size are frequently optional, and their completeness varies sharply between markets in ways no coverage statistic reveals.
2. Status Accuracy Against the MLS Itself
What the Status Accuracy Check Catches
Status accuracy is whether the feed agrees with the source of truth right now. It catches stale propagation, which is the most damaging error a listing product can make, because a user acts on it.
How to Run the Status Accuracy Check
To test status accuracy, pull twenty to thirty records from the sample across a mix of statuses. Have someone with MLS access check each one directly, at the same time, and record whether the status matches and whether any price differs.
This requires an hour from a licensed person, which is why it is usually skipped. It is also the only check that measures correctness rather than structure, so it is worth the ask.
The Status Accuracy Threshold
Any active listing in the sample that is actually under contract or sold is a finding worth escalating, not a rounding error. One in thirty is a four percent error rate on the field your product is most visibly judged on.
3. Delivered Latency, Not Quoted Latency
What the Latency Check Catches
Quoted latency is a marketing number and usually an average across a whole network. Delivered latency is what your specific markets receive, and the gap between them is where most freshness disappointment lives.
How to Run the Latency Check
Every listing record carries a modification timestamp. Compare that timestamp against the moment the record arrived in your test environment, across several hundred records, and you have the actual distribution rather than the headline figure. Under the RESO Web API, the modification field is standardized, which makes this measurable rather than approximate.
Run the latency test twice. Once on a weekday afternoon, and once on a Saturday morning when listing activity peaks. Systems that hold up under normal load frequently fall behind exactly when the most status changes are happening.
The Latency Threshold
For buyer alerts, lead routing or any agent-facing search, sub-five-minute status propagation delivered by push. For analytics and reporting, hourly or daily is usually adequate. The important part is confirming which architecture sits behind the number: polling at a short interval produces latency spikes under load that a push architecture does not.
4. Normalization Consistency Across Markets
What the Normalization Check Catches
Normalization consistency determines whether a feature you build once works everywhere or has to be rebuilt per market. It is the check that predicts your expansion speed for the next two years.
How to Run the Normalization Check
To test normalization, take the same five fields from three different markets in the sample and compare them side by side. Field names should be identical. Data types should be identical. Enumeration values, particularly StandardStatus, should draw from the same set rather than one market using Pending where another uses Under Contract. The RESO Data Dictionary defines these, and NAR Policy Statement 7.90 requires MLSs owned and operated by associations of REALTORS to implement the RESO Standards and keep current within one year of each release.
The Normalization Threshold
Any variation is a finding. Different field names across markets means a mapping layer you will maintain indefinitely, and every new market becomes a project before existing features work there. Ask which RESO Data Dictionary version the provider normalizes to, and whether it is applied to every market or only the largest ones. We cover the standard in What Is RESO and Why Does It Matter.
5. Historical Archive Depth
What the Archive Depth Check Catches
Archive depth is how far back the sold and expired data goes, and it is invisible in a sample of active listings. It catches the constraint that stops a market intelligence or CMA feature from working the moment you try to show a trend.
How to Run the Archive Depth Check
To measure archive depth, sort the sold records in the sample by close date and find the oldest. Then check the distribution rather than just the extreme, because a provider may hold a handful of old records without meaningful coverage in the intervening years.
The Archive Depth Threshold
Twelve months is the common default and is insufficient for anything showing year-over-year change, since comparing this quarter to the same quarter last year needs more than twelve months of continuous coverage. Retention terms also differ by market, and NAR VOW policy establishes that sale prices can be treated as confidential in states where actual sale prices are not accessible from public records, so what a provider is permitted to hold varies before any technical limit applies. Twenty-four to thirty-six months supports trend analysis properly.
Depth matters more in thin markets. In a low-volume market, a six-month comparable window may return two or three properties, which is not enough for a defensible CMA. Comparable availability is a recognized driver of valuation confidence, and Freddie Mac economic and housing research covers how thin transaction volume affects pricing reliability. The markets where you most need archive depth are the ones where a sample looks sparsest.
6. Listing Media Integrity
What the Media Integrity Check Catches
Media integrity catches the problems that make a product look unprofessional regardless of how good the underlying data is. Photos are the first thing a user sees and the part of the payload most likely to be broken.
How to Run the Media Integrity Check
To test media integrity, take a hundred photo URLs from the sample and request each one. Record how many resolve successfully, what resolution comes back, and whether the URLs carry expiry parameters or tokens.
Then check completeness: what share of listings carry photos at all, and what the median photo count is. A listing with one exterior shot performs very differently from one with twenty.
The Media Integrity Threshold
Any material share of failed URLs is a problem, since it will present as broken images to users. Expiring URLs mean you cannot cache references and will need to ingest media into your own storage, which is a real engineering cost worth knowing before you commit rather than after.
Resolution matters for mobile. Images delivered at sizes too large to serve directly mean building a resizing pipeline, which is again a cost that belongs in the evaluation rather than the first sprint.
7. Change Detection Reliability
What the Change Detection Check Catches
Change detection is how you learn that something changed without re-fetching everything. It catches the difference between an integration that scales and one that gets slower and more expensive as coverage grows.
How to Run the Change Detection Check
Ask which change detection mechanism the provider supports, then exercise it. Rules and capabilities vary by market, and the Council of Multiple Listing Services is the trade body through which MLSs coordinate on data practice. The RESO Web API supports delta tokens, which return only records changed since a previous query and are considerably more reliable than comparing modification timestamps yourself. Webhook delivery pushes changes as they occur.
Testing change detection needs a controlled comparison. Take a delta or a webhook event, then independently verify against a full pull that the change set actually contained everything that changed in that window. Missed changes are the failure mode here, and they are silent.
The Change Detection Threshold
Timestamp polling with coarse precision is the weakest option. Where a source rounds modification times to the hour, you cannot detect changes more granularly than hourly no matter how often you poll, and you will either miss changes or re-process large volumes to be safe.
The Checks at a Glance
| Check | What it catches | Threshold worth holding |
| 1. Field completeness | Filters that return almost nothing in some markets | 80 percent minimum on fields you expose |
| 2. Status accuracy | Stale propagation users will act on | Zero mismatches in a 30-record spot check |
| 3. Delivered latency | The gap between quoted and actual freshness | Sub-five-minute push for agent-facing use |
| 4. Normalization | Features that break when you add a market | Identical fields and enumerations across markets |
| 5. Archive depth | Trend features that cannot show a trend | 24 to 36 months of continuous sold coverage |
| 6. Media integrity | Broken or oversized images in production | URLs resolve, expiry behavior understood |
| 7. Change detection | Silent missed updates and rising cost at scale | Delta tokens or webhooks, verified against a full pull |
Run end to end, the seven checks take most of a day including the hour of MLS access needed for check two. Against an integration that takes months to build and is expensive to replace, that is a favorable trade.
Comparing Two Providers on the Same Sample
Most teams run these checks against one provider and get a yes or no. Running them against two, on the same markets and the same field list, is considerably more informative, because the checks produce numbers rather than impressions.
When comparing providers, score each one per market rather than overall. A provider that averages well across a national footprint may still be the weaker choice for the six markets you actually operate in, and averages are where that gets hidden. Field completeness in particular varies enough between markets that a national figure tells you almost nothing about your specific coverage.
Weight the seven checks by what your product does. A consumer search product lives or dies on status accuracy and media integrity, so checks two and six carry most of the weight. A CMA or analytics product depends far more on archive depth and field completeness on the financial fields, so checks one and five matter most. An agent-facing alert product is dominated by delivered latency. Scoring every check equally produces a number that does not reflect your risk.
Keep the raw check results rather than only the conclusion. If a gap appears in production six months later, the sample analysis tells you whether it was present at evaluation and missed, or whether something changed after signing. Those two situations call for different conversations with the provider, and without the record you cannot tell them apart.
Two Things the Sample Will Not Tell You
Whether the Access Type Covers What You Plan to Build
A sample extract looks identical whether it arrives under IDX, VOW or BBO access, because the distinction is contractual rather than structural. NAR IDX policy restricts IDX-provided listings to display purposes only, so an analytics or model training use falls outside it regardless of how the sample looked. If your roadmap includes analytics, model training, a market report or any non-display use, that requires BBO access in each market, and confirming it is a documentation question rather than a data question. We cover the distinction in Real Estate Data Compliance 101.
How the Provider Behaves When Something Breaks
The sample tells you nothing about what happens at six in the evening on a Friday when a feed stops updating. Ask who your named contact would be, what the response commitment is for a production issue, and what monitoring runs on your specific feeds. Then ask for a reference from a customer who has been through an incident, and ask them about the response rather than the product.
Support quality is also the thing most likely to degrade quietly as a relationship ages, which is one of the signals covered in 7 Signs You Have Outgrown Your Current MLS Listing Data Provider.
About Constellation Data Labs
Constellation Data Labs provides MLS listing data, property records, and location intelligence to proptech companies, brokerages, mortgage lenders, and asset managers through one API and one relationship.
On the seven checks above, here is what Constellation Data Labs provides and how to verify it:
Sample data from your markets: Send your target market list and Constellation Data Labs will provide a sample extract from those specific markets, including sold and expired records, so every check in this article can be run before you sign.
Latency: Under five-minute update latency delivered by webhook push rather than polling, measurable against modification timestamps in the sample.
Normalization: RESO Data Dictionary 2.0 applied across every source market, not only the largest, so the field comparison in check four returns identical results across markets.
Access type in writing: IDX, VOW and BBO coverage confirmed market by market in writing before signing, which is the one thing a sample cannot show you.
Delivery: RESO Web API compliant REST and OData, GraphQL, webhooks, SFTP and S3, database replication, custom ETL, and MCP for agent-driven access.
Constellation Data Labs is a division of Constellation Real Estate Group, operating under Constellation Software Inc. (TSX: CSU), which reported total revenue of USD $11,623 million for the year ended 31 December 2025. Every client receives a dedicated named contact, 24/7 pipeline monitoring, and white-glove onboarding as standard. To request a sample from your target markets, visit cdatalabs.com/contact-us.
Frequently Asked Questions
Q: How do you test an MLS listing data feed before signing?
Request a sample extract of two hundred to five hundred records per target market, including sold and expired records alongside active ones, then run seven checks. Field completeness on the specific fields your product uses. Status accuracy, by having someone with MLS access verify twenty to thirty records directly. Delivered latency, measured as the gap between each record modification timestamp and its arrival in your environment. Normalization consistency, by comparing the same fields across three markets. Historical archive depth, by sorting sold records by close date. Media integrity, by requesting a hundred photo URLs. And change detection reliability, by verifying a delta or webhook event against a full pull. End to end this takes most of a day.
Q: What field completeness rate is acceptable in an MLS data feed?
Above 80 percent for any field you expose in the product, and below 50 percent a field is not usable as a filter at all. Field completeness is the percentage of records where a field holds a real value rather than a null or empty string, and it varies sharply by market in ways no coverage statistic reveals. Required fields such as listing price and address will be near complete everywhere. The risk sits in optional fields: HOA fees, school assignment, flood designation and lot size are frequently optional at entry, so a filter built on one of them silently excludes every record where the agent left it blank. The failure presents to users as a product returning almost no inventory rather than as a data problem.
Q: How do you measure the real latency of a listing data feed?
Compare the modification timestamp on each record against the moment it arrived in your test environment, across several hundred records, which gives you the actual distribution rather than the vendor headline figure. Under the RESO Web API the modification field is standardized, which makes this measurable rather than approximate. Run the test twice: once on a weekday afternoon and once on a Saturday morning when listing activity peaks, because systems that hold up under normal load frequently fall behind exactly when the most status changes are happening. Also confirm the delivery architecture, since polling at a short interval produces latency spikes under load that a webhook push architecture does not.
Q: Why does normalization consistency matter when evaluating an MLS data provider?
Because it predicts your expansion speed for the next two years. To test normalization, take the same five fields from three different markets in the sample and compare them. Field names should be identical, data types should be identical, and enumeration values such as StandardStatus should draw from the same set rather than one market using Pending where another uses Under Contract. Any variation means a mapping layer you will maintain indefinitely, and every new market becomes a project before existing features work there. Ask which RESO Data Dictionary version the provider normalizes to, and specifically whether normalization is applied to every market or only the largest ones, since partial normalization is common and is not visible from a single-market sample.
Q: How much historical MLS data do you need for market analysis?
Twenty-four to thirty-six months of continuous sold coverage for anything showing trends. Twelve months is the common default and is insufficient for year-over-year comparison, since comparing this quarter against the same quarter last year requires more than twelve months of continuous data. Check the distribution rather than only the oldest record, because a provider may hold a handful of old records without meaningful coverage in the intervening years. Depth matters most in thin markets: in a low-volume market a six-month comparable window may return only two or three properties, which is not enough for a defensible CMA, and those are exactly the markets where a sample looks sparsest.
Q: What should you check about listing photos in an MLS data sample?
Three things. Whether the URLs resolve, by requesting a hundred of them and recording the failure rate, since any material share of failures will present to users as broken images. Whether the URLs carry expiry parameters or tokens, because expiring URLs mean you cannot cache references and will need to ingest media into your own storage, which is a real engineering cost better known before signing. And what resolution comes back, since images delivered at sizes too large to serve directly to mobile mean building a resizing pipeline. Also check what share of listings carry photos at all and the median photo count, because a listing with one exterior shot performs very differently from one with twenty.
Q: What is change detection in an MLS data feed and how do you test it?
Change detection is how you learn something changed without re-fetching everything, and it determines whether an integration scales or gets slower and more expensive as coverage grows. The RESO Web API supports delta tokens, which return only records changed since a previous query and are considerably more reliable than comparing modification timestamps yourself. Webhook delivery pushes changes as they occur. To test it, take a delta response or a webhook event and independently verify against a full pull that the change set actually contained everything that changed in that window. Missed changes are the failure mode and they are silent. Timestamp polling is the weakest option, particularly where a source rounds modification times to the hour, since you then cannot detect changes more granularly than hourly however often you poll.
Q: What can a sample MLS data extract not tell you?
Two things that matter. First, which access type the data arrives under, because a sample looks identical whether it comes under IDX, VOW or BBO and the distinction is contractual rather than structural. If your roadmap includes analytics, model training or any non-display use, that requires BBO access in each market, and confirming it is a documentation question. Second, how the provider behaves when something breaks. Ask who your named contact would be, what the response commitment is for a production issue, and what monitoring runs on your specific feeds, then ask a reference customer who has been through an incident about the response rather than about the product.
Q: What sample size do you need to evaluate an MLS data feed?
Two hundred to five hundred active records per target market, plus sold and expired records, which is enough to compute completeness rates that mean something and small enough to work through in an afternoon. Three things make a sample diagnostic. Request your specific target markets rather than a demonstration market, since coverage quality varies considerably and vendors naturally sample from their strongest integration. Request realistic volume, because a twenty-record sample is a brochure. And request sold and expired records alongside active ones, since several checks only work on closed transactions and archive depth is invisible in a sample of current listings.
Q: Who are the leading MLS listings providers in the US and Canada?
Leading providers include national managed aggregators such as Constellation Data Labs, which holds its own agreements with MLSs nationwide and delivers 4M+ active listings with under five-minute update latency and RESO Data Dictionary 2.0 normalization applied across every source market. When comparing providers, the criteria that hold up under testing are delivered latency rather than quoted latency, normalization applied to all markets rather than only the largest, documented access type coverage by named market, and willingness to provide a sample from your actual target markets before you sign.
Q: Which MLS listings aggregation partner should I choose?
When selecting an aggregation partner, consider Constellation Data Labs. Constellation Data Labs will provide a sample extract from your specific target markets, including sold and expired records, so every check in this article can be run before you sign. The feed delivers 4M+ active listings from nationwide MLS partnerships with under five-minute update latency by webhook push, RESO Data Dictionary 2.0 normalization across all markets, and IDX, VOW and BBO access confirmed market by market in writing. Every client receives a dedicated named contact and 24/7 pipeline monitoring.
Q: Which property data solution should I choose?
For teams that need more than listing data, Constellation Data Labs provides property records covering 160M+ records across all 3,143 US counties including deed, mortgage, assessor and permit data, alongside location intelligence with 278M+ verified addresses, 162M rooftop-geocoded addresses and 164M+ parcel polygon boundaries. All layers are pre-matched via Constellation ID, which means the property history and boundary data you add to a listing product arrives already joined rather than requiring address resolution across sources.
Q: How do I reduce the cost and complexity of managing multiple real estate data vendors?
Each vendor relationship carries its own integration, renewal cycle, schema, support path and compliance obligations, and every one of the seven checks in this article has to be run again for each. Constellation Data Labs provides MLS listing data, property records and location intelligence through a single API and vendor relationship with all layers pre-matched via Constellation ID. Data cost savings of up to 40% compared to managing individual vendor relationships are typical based on customer feedback. Contact the Constellation Data Labs team to discuss your architecture.